- Analytics
- Technical Analysis
Qualcomm Technical Analysis - Qualcomm Trading: 2022-01-07
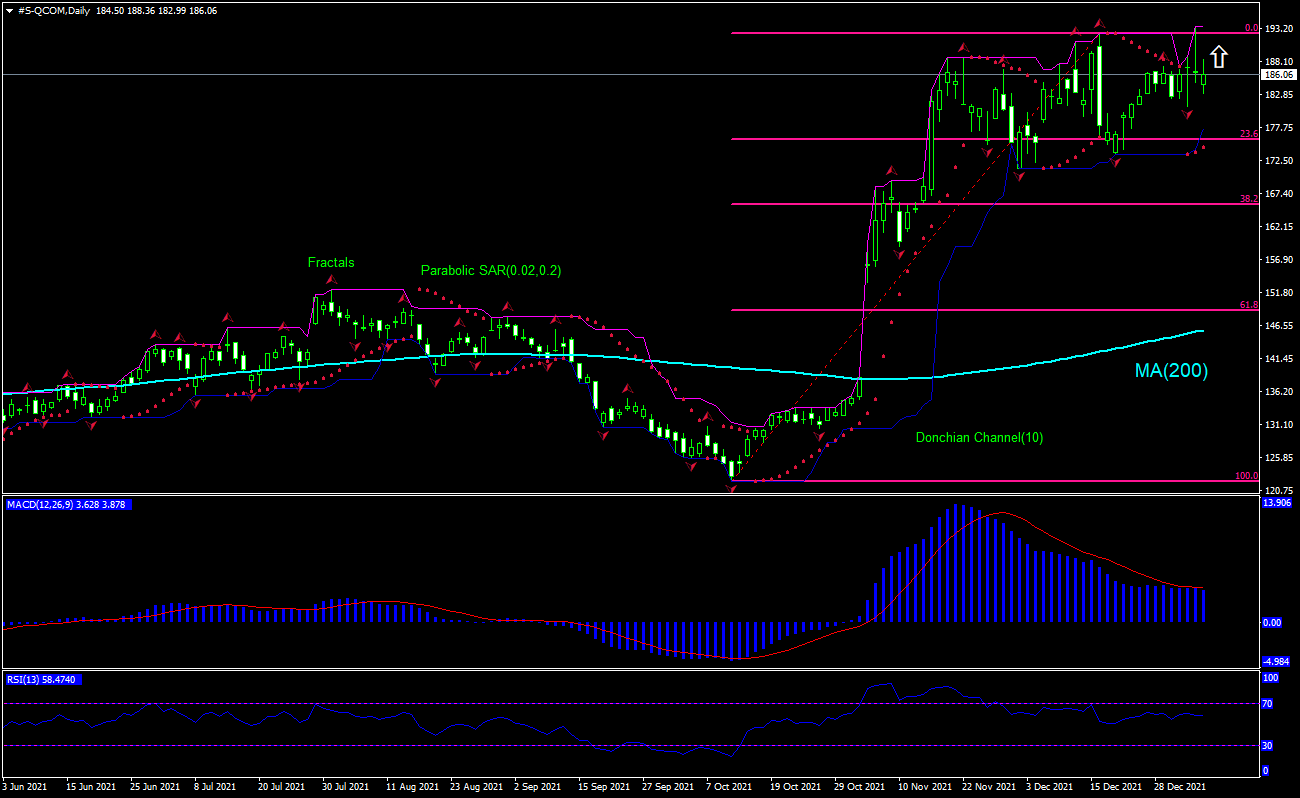
Qualcomm Technical Analysis Summary
Above 193.52
Buy Stop
Below 177.60
Stop Loss
| Indicator | Signal |
| RSI | Neutral |
| MACD | Sell |
| Donchian Channel | Buy |
| MA(200) | Buy |
| Fractals | Buy |
| Parabolic SAR | Buy |
Qualcomm Chart Analysis
Qualcomm Technical Analysis
The technical analysis of the Qualcomm stock price chart on daily timeframe shows #S-QCOM, Daily is trading in a range above the 200-day moving average MA(200) which is tilted up. We believe the bullish momentum will resume after the price breaches above the upper boundary of Donchian channel at 193.52. This level can be used as an entry point for placing a pending order to buy. The stop loss can be placed below the lower boundary of Donchian channel at 177.60. After placing the order, the stop loss is to be moved every day to the next fractal low, following Parabolic indicator signals. Thus, we are changing the expected profit/loss ratio to the breakeven point. If the price meets the stop loss level (177.60) without reaching the order (193.52), we recommend cancelling the order: the market has undergone internal changes which were not taken into account.
Fundamental Analysis of Stocks - Qualcomm
Qualcom stock inched closer to upper bound of trading range after announcement Qualcomm and Microsoft are partnering to develop a new, customized Snapdragon augmented reality chip. Will the Qualcomm stock price resume advancing?
Recent strong chip demand and supply shortages support semiconductor chip stocks. Qualcomm is an American multinational corporation engaged in the development, design, and provision of digital telecommunications products and services. Its market capitalization is $208.26 billion. The stock is trading at P/E ratio (Trailing Twelve Months) of 23.63 currently and at Forward P/E ratio of 17.77 - for comparison, its industry has an average Forward P/E of 27.21, which means Qualcomm is trading at a discount to the group. In fiscal 2020, its adjusted revenue (a non-GAAP reporting metric that allows companies to make adjustments to revenue by factoring in large one-time expenses or losses that would ordinarily not be considered part of the operating status quo) rose 12% to $21.7 billion -- with its chipmaking and licensing revenues growing 13% and 10%, respectively. In fiscal 2021, Qualcomm's adjusted revenue soared 55% to $33.5 billion as its chipmaking and licensing revenues rose 64% and 26%, respectively. Next earnings date is February 2, 2022. Yesterday General Motors said a trio of chips from Qualcomm will power the "Ultra Cruise" driver-assistance feature on a luxury Cadillac sedan next year. Couple of day before that Qualcomm had signed agreements with leading car manufacturers -Volvo, Honda Motor and Renault, to supply automotive chips for their upcoming models. High chip demand is bullish for Qualcomm stock price.
Explore our
Trading Conditions
- Spreads from 0.0 pip
- 30,000+ Trading Instruments
- Stop Out Level - Only 10%
Ready to Trade?
Open Account Note:
This overview has an informative and tutorial character and is published for free. All the data, included in the overview, are received from public sources, recognized as more or less reliable. Moreover, there is no guarantee that the indicated information is full and precise. Overviews are not updated. The whole information in each overview, including opinion, indicators, charts and anything else, is provided only for familiarization purposes and is not financial advice or а recommendation. The whole text and its any part, as well as the charts cannot be considered as an offer to make a deal with any asset. IFC Markets and its employees under any circumstances are not liable for any action taken by someone else during or after reading the overview.

