- Analytics
- Technical Analysis
Retrospective of Technical Analysis GB100 From 2021-04-09
GB100 forecast bullish after positive data

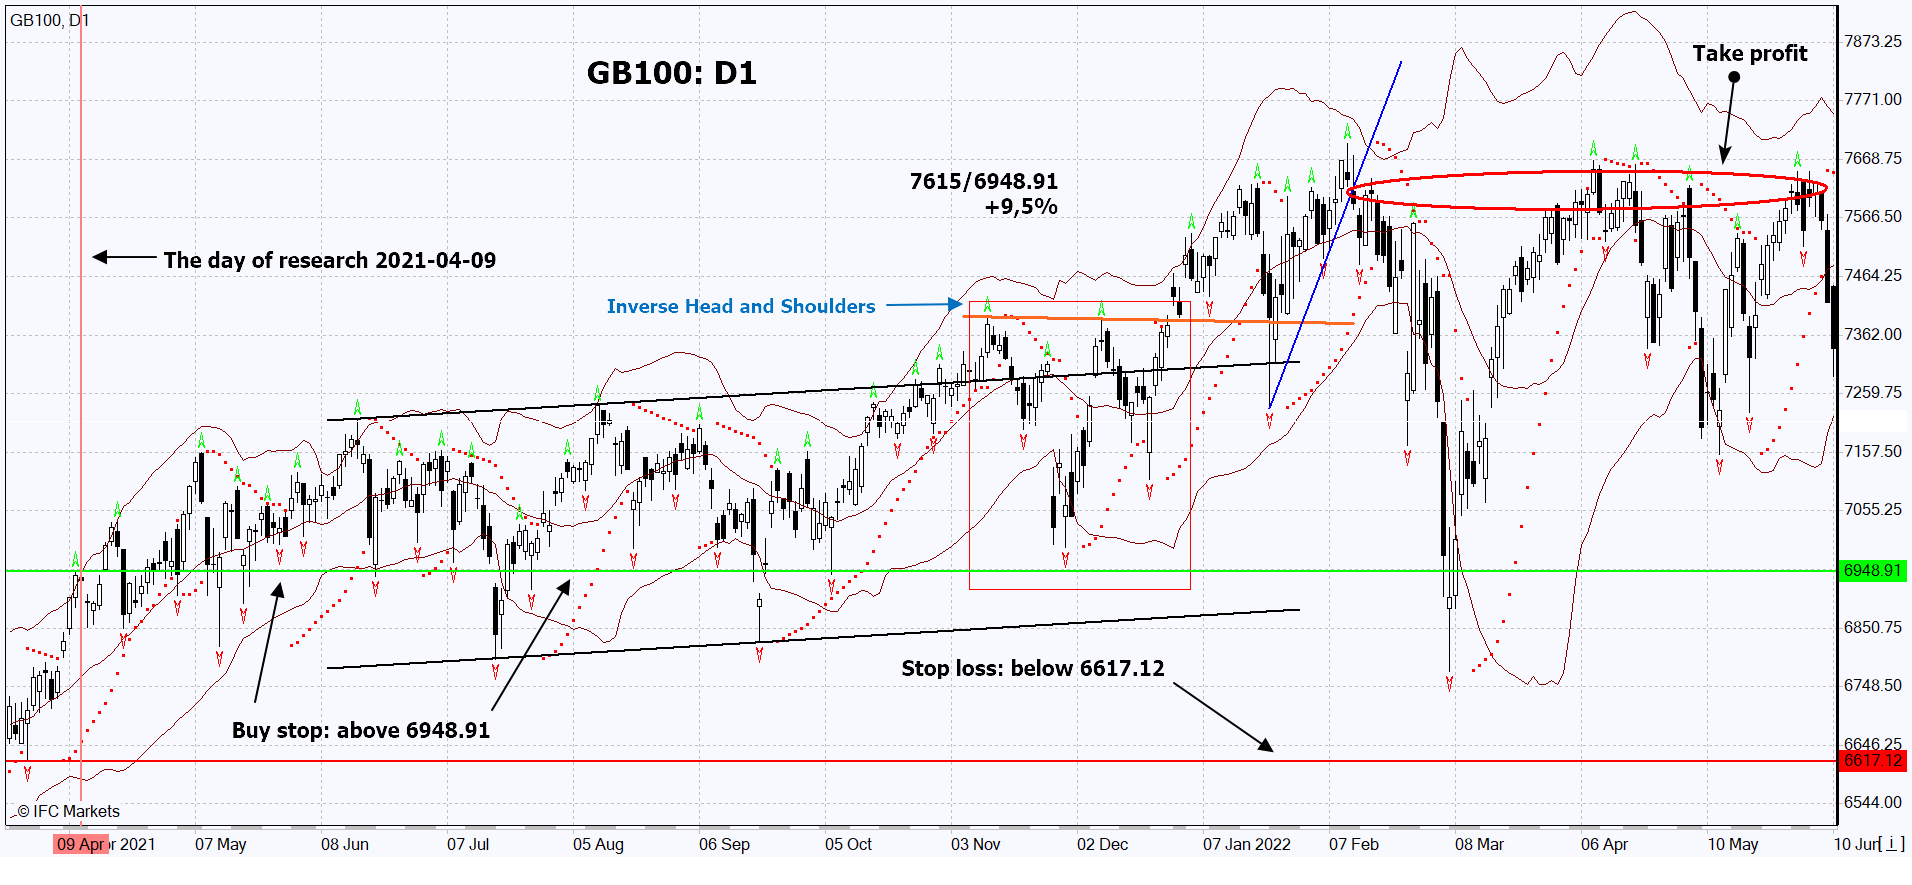
The chart shows the real change of quotations after the publication of technical analysis on 2021-04-09. The pending order from this analysis was executed and the position was opened. Next, we shall move the stop to the next fractal low following the Bollinger Bands and Parabolic SAR signals at the 4-hour charts. Thus, we are changing the potential profit/loss to the breakeven point. The position shall be closed when the price meets the Bollinger bands, the Parabolic SAR, the trend line and the fractal indicator.
New Exclusive Analytical Tool
Any date range - from 1 day to 1 year
Any Trading Group - Forex, Stocks, Indices, etc.
