- Analytics
- Technical Analysis
USD/CHF Technical Analysis - USD/CHF Trading: 2018-02-12
Preparing for the publication of inflation data in Switzerland
The US dollar index rose by 1.7% in a week and demonstrated a maximum increase in 15 months. Perhaps its strengthening will continue in relation to some currencies as well. Will the USDCHF grow?
Their increase indicates the strengthening of the US dollar against the Swiss franc. The main reasons for the US dollar growth are the expectations of the Fed rate hike at the meeting on March 21, 2018. Currently, it is 1.5%, while the rate of the Swiss National Bank is negative and equal to minus 0.75%. The difference in rates can contribute to the strengthening of the dollar. Note that on Friday, February 9, not so good data on unemployment for January came out in Switzerland. It rose to 3.4% from 3.3% in December. The next significant economic statistics in Switzerland will be published on February 12 - inflation for January. It is expected be 0.8% as in December year-over-year.
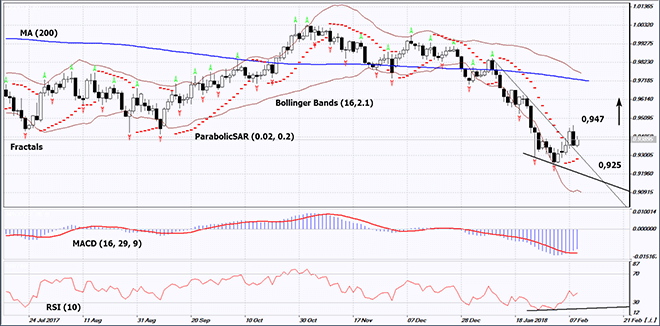
On the daily timeframe, USDCHF: D1 went to the top of the downtrend. The further price increase is possible in case of the publication of positive economic data in the US and negative in Switzerland.
- The Parabolic indicator gives a bullish signal.
- The Bollinger bands have widen, which indicates high volatility.
- The RSI indicator is below 50. It has formed a positive divergence.
- The MACD indicator gives a bullish signal.
The bullish momentum may develop in case USDCHF exceeds the last high at 0.947. This level may serve as an entry point. The initial stop loss may be placed below the last fractal low, the minimum for 2 and a half years and the Parabolic signal at 0.925. After opening the pending order, we shall move the stop to the next fractal low following the Bollinger and Parabolic signals. Thus, we are changing the potential profit/loss to the breakeven point. More risk-averse traders may switch to the 4-hour chart after the trade and place there a stop loss moving it in the direction of the trade. If the price meets the stop level at 0.925, without reaching the order at 0.947, we recommend cancelling the position: the market sustains internal changes that were not taken into account.
Summary of technical analysis
| Position | Buy |
| Buy stop | Above 0,947 |
| Stop loss | Below 0,925 |
Explore our
Trading Conditions
- Spreads from 0.0 pip
- 30,000+ Trading Instruments
- Stop Out Level - Only 10%
Ready to Trade?
Open Account Note:
This overview has an informative and tutorial character and is published for free. All the data, included in the overview, are received from public sources, recognized as more or less reliable. Moreover, there is no guarantee that the indicated information is full and precise. Overviews are not updated. The whole information in each overview, including opinion, indicators, charts and anything else, is provided only for familiarization purposes and is not financial advice or а recommendation. The whole text and its any part, as well as the charts cannot be considered as an offer to make a deal with any asset. IFC Markets and its employees under any circumstances are not liable for any action taken by someone else during or after reading the overview.
