- Analytics
- Technical Analysis
US Dollar Index Technical Analysis - US Dollar Index Trading: 2016-01-13
Fresh US dollar high to be hit
US dollar index has been moving sideways for almost the whole year now with a noticeable 6% range. At the start of 2016 the risks from Chinese economy heightened. On the other hand, the positive macroeconomic data was released in the US. Will the US dollar get even stronger?
The US Fed hikes the interest rates by 0.25 percentage points in December 16, 2015, for the first time since June 2006, and said the further hike by 1 percentage point is likely in 2016. The data supported the US dollar index. The further rate increase depends on the US economic conditions which determine the dollar exchange rate. They are quite strong upon the whole. The US GDP growth in 3Q slowed down to 2% from 3.7% in the 2nd quarter but was still above the expectations. The consumer confidence index came out strong for December supported by the positive US labour market data. The December unemployment remained at 5% which is the lowest in 7 and ½ years. The nonfarm payrolls were much better than expected. The risk of the Chinese economic slowdown is another factor which supports the dollar. The industrial PMI in December was far below the forecasts falling for 10 consecutive months. We believe the further US dollar dynamics will depend on the US retail sales and inflation to come out on January 15 and 20. In China the important data will be released on January 13 (trade balance) and January 19 (GDP and industrial production).
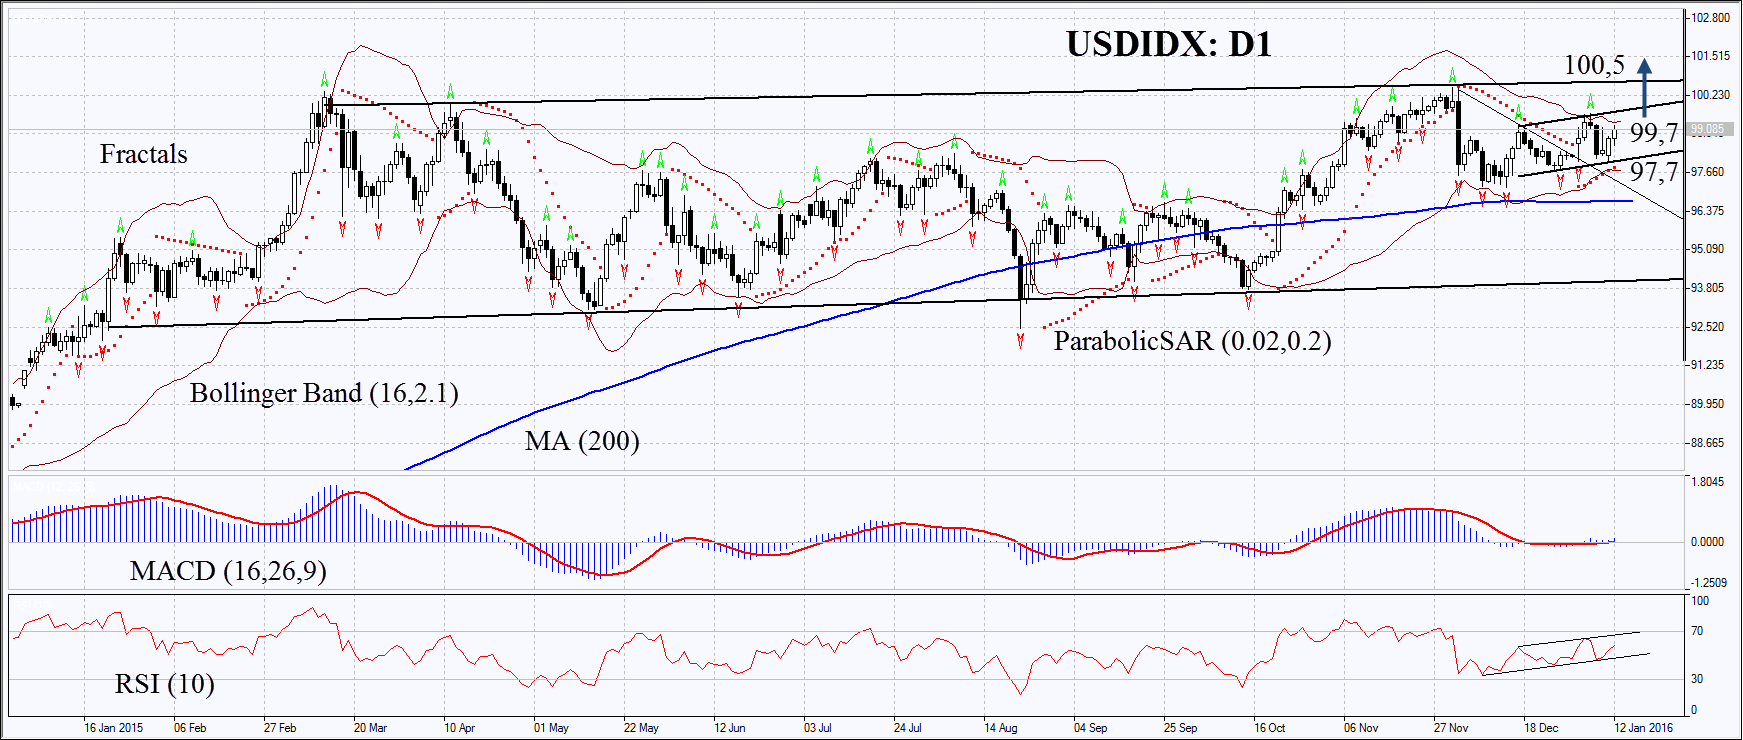
On the daily chart USDIDX: D1 began to edge up within the neutral channel. The Parabolic indicator gives buy signal. MACD is neutral because of the minimal histogram bars. The Bollinger bands have contracted a lot which may mean ultra-low volatility. Quite often indicators give such signals ahead of the strong market movement. RSI has not reached the overbought zone but is above 50. It is in uptrend but no divergence is seen. Short positions may be opened after the break through the 200-day moving average which is quite a long way to go. Let’s consider opening the long position. The bullish momentum may develop in case the US dollar surpasses the last fractal high, the Bollinger band and the resistance of the short-term uptrend at 99.7. This level may serve the point of entry. The most conservative traders may wait for the break through the 13-year high at 100.5. The initial risk-limit may be placed below the support of the uptrend, two last fractal highs, the Bollinger band and the Parabolic signal at 97.7. Having opened the pending order we shall move the stop to the next fractal low following the Parabolic and Bollinger signals. Thus, we are changing the probable profit/loss ratio to the breakeven point. The most risk-averse traders may switch to the 4-hour chart after the trade and place there a stop-loss moving it in the direction of the trade. If the price meets the stop-loss level at 97.7 without reaching the order at 99.7 or 100.5, we recommend cancelling the position: the market sustains internal changes which were not taken into account.
| Position | Buy |
| Buy stop | above 99.7 or 100.5 |
| Stop loss | below 97.7 |
Explore our
Trading Conditions
- Spreads from 0.0 pip
- 30,000+ Trading Instruments
- Stop Out Level - Only 10%
Ready to Trade?
Open Account Note:
This overview has an informative and tutorial character and is published for free. All the data, included in the overview, are received from public sources, recognized as more or less reliable. Moreover, there is no guarantee that the indicated information is full and precise. Overviews are not updated. The whole information in each overview, including opinion, indicators, charts and anything else, is provided only for familiarization purposes and is not financial advice or а recommendation. The whole text and its any part, as well as the charts cannot be considered as an offer to make a deal with any asset. IFC Markets and its employees under any circumstances are not liable for any action taken by someone else during or after reading the overview.
